While watching several Subbuteo Table Football games on YouTube, I got to know the shooting habits of some of the top players. But I wanted to go deeper and started a Subbuteo shot analysis of at least 500 shots. Here’s what I found out.
Even for Subbuteo beginners, the basic strategy is obvious: Attack an opponent through the wings or try to draw his or her defending line out of position by hovering around the middle. A lot of players do so because the wings are invitingly open unless the defending figures are shifted there quickly.
So for my Subbuteo shot analysis, I assumed that the majority of all shots (misses and goals) would eventually come from a diagonal angle to the goal. With descriptive statistical methods, I wanted to find out which spots on the pitch are the most promising for shooting many goals.
Binge-watching on YouTube: The investigation begins...
Let’s make one thing clear: This is NOT a representative study. All I had in mind was to record and evaluate at least 500 shots from various Table Football matches. So I randomly chose 27 fulltime games that I found on YouTube (all links at the end of this post) and listed any shot from these games in an Excel sheet. I differentiated between goals and misses and wrote down the players’ names, too.
I finally produced a sheet with 502 shots and their exact positions (x- and y-coordinats) on the pitch, 135 shots led to goals, so the shooting percentage (Pct) was 0.27.
Even table-loving nerds will cry for visualization at this point. Okay, here we go: The first chart gives an overview of all recorded Subbuteo shots. The red dots show the positions of missed shots, the green ones show the goals achieved.
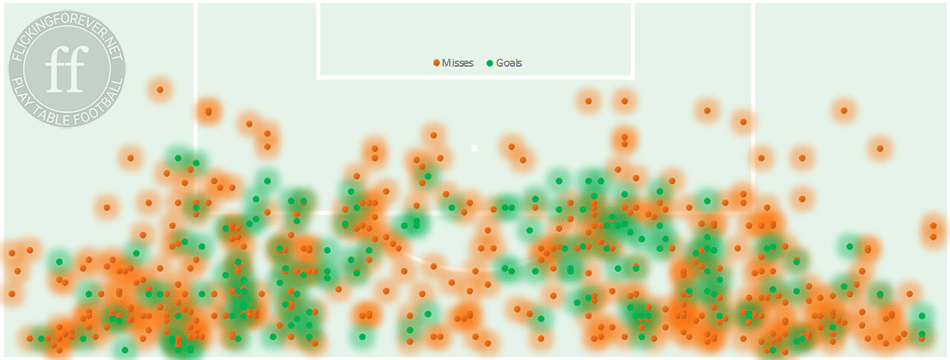
Chart 1: Visualization of goal shots in a point cloud, showing goals and misses.
There’s the well expected accumulation of shots from the left and right wing. The reason is obvious as mentioned before: Facing strong defensive lines, top players will have to shift their attacking figures to the far right or left to enter the shooting area.
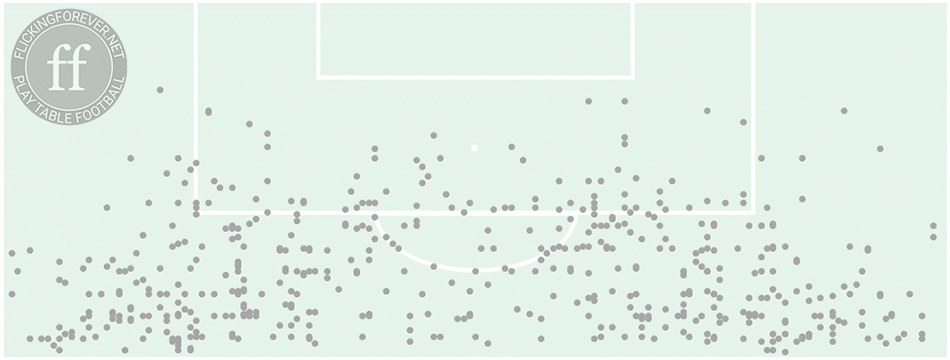
Chart 2: Visualization of all 502 Subbuteo goal shots in a point cloud.
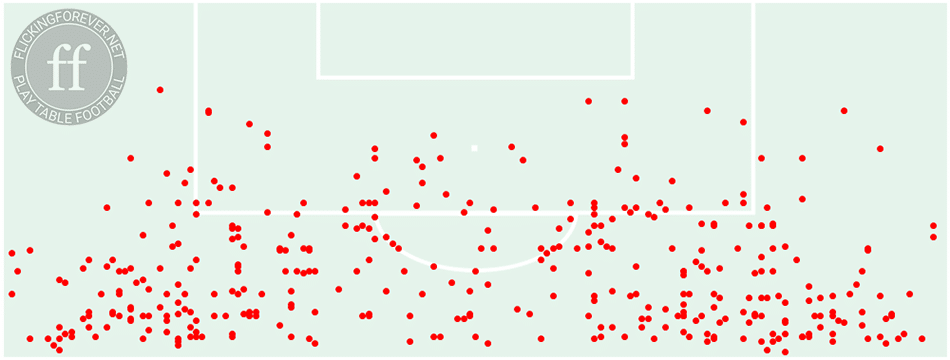
Chart 3: Visualization of 367 missed goal shots in a point cloud.
The chart above represents all the goal shots that had not been successful. You will clearly see shots close to the shooting line tend to be less successful over all.
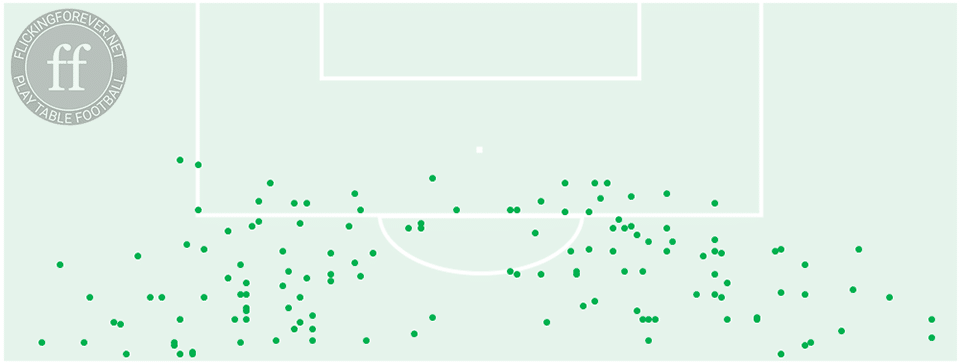
Chart 4: Visualization of 135 goals in a point cloud.
Update Sep 24th:
After publishing the first version of this article, FISTF president Steve Dettre asked me if there was a difference between players shooting left handed or right handed. Fortunately, I had captured these informations as well. Here are two charts that visualize all shots from left-handers and right-handers. (Click to open lightbox.)
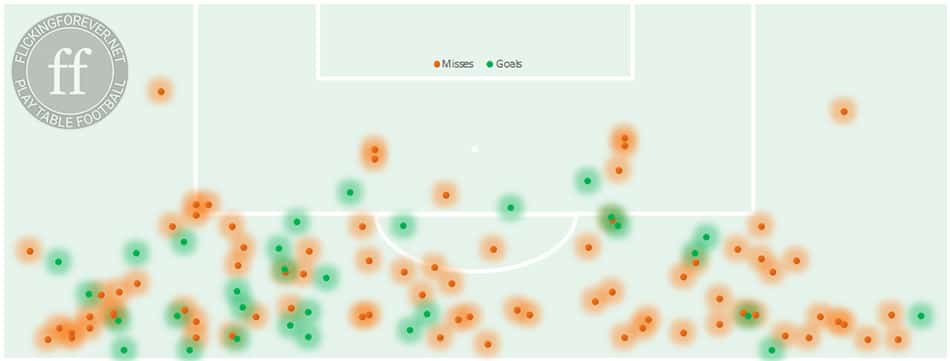
Chart 5 shows all shots (misses=red, goals=green) from left-handers. You can see clearly that more shots and goals are achieved from the left wing. Shots from the right wing tend be less dangerous over all.
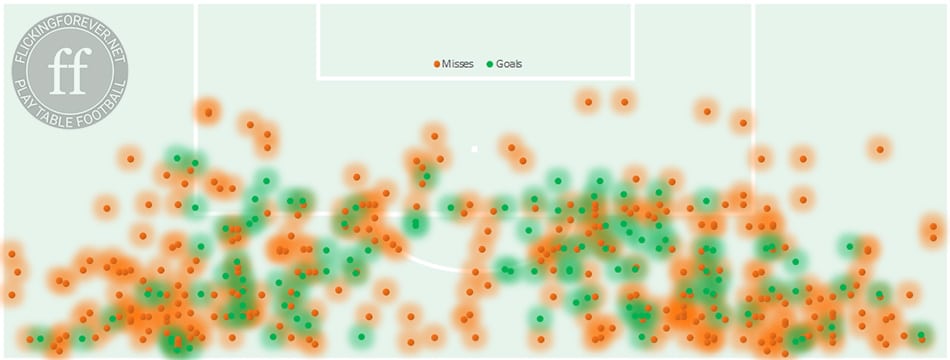
Chart 6 shows all shots (misses=red, goals=green) from right-handers. These players are very successful from the right wing or whenever they shot from close to the penalty box.
A heatmap says more than 1.000 words
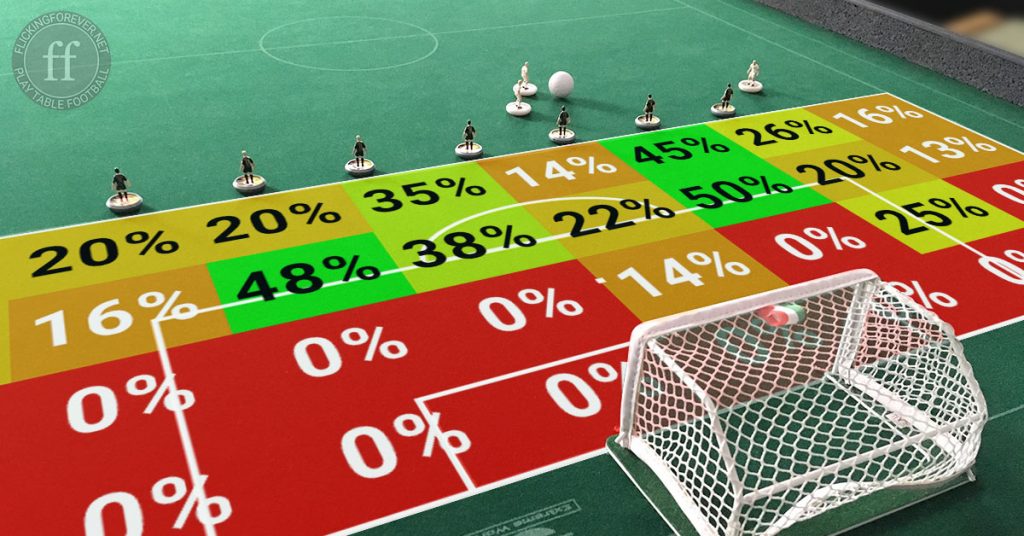
In a next step, I tried to aggregate these dotted charts. A heatmap seemed to be the perfect visual method for the Subbuteo shot analysis so I devided the shooting area into 8 x 4 equal sectors and calculated shooting percentages (Pct) for each sector.
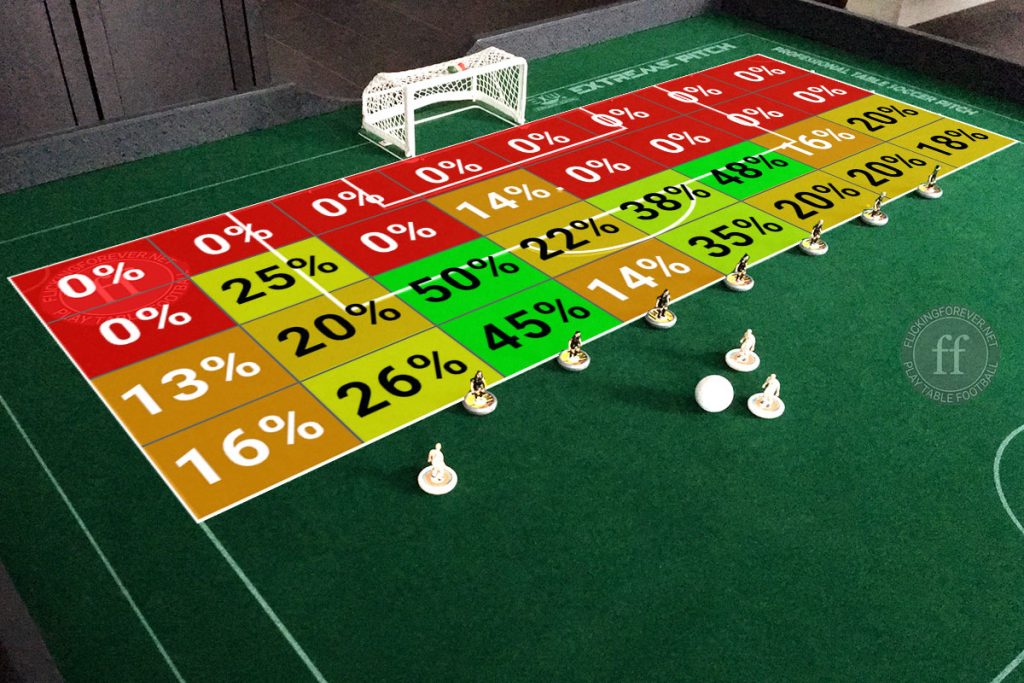
The heatmap shows shooting percentages (Pct) in 32 sectors of the shooting area. 50% means that every second shot from this sector had led to a goal.
Sectors A1 to A8 show a 0% chance of scoring a goal from there (might be possible in Association Soccer with a fancy curve ball, but in Subbuteo? Forget it!). Most sectors in the second row – B1 to B8 – are unlikely areas for many goals and often get the 0% label as well.
In the rows C and D we finally identify the best sectors to shoot a goal. Watch out for C3 (50%), C6 (48%) and D3 (45%) with a really promising Pct. In these sectors, I counted 41 goal (from 91 shots).
In an upcoming blog post, I will try to work out some tactics and exercises to reach these sectors more often with your attackers. But for now we will have a detailed look at some of the featured top players.
How the World champion performs in sector C3
Matteo Ciccarelli (Italy) has won the World Cup 2018 in the Open Category in early September. In the first chart of the slideshow below, you see his personal shooting stats which I collected in four of his games. It’s interesting that he is likely to shoot more goals from the left side.
Swipe left/right to see the stats of at least nine players!
One more word on the current World Champion: I also investigated how successful players had been from the “green sectors” C3 (Pct 50%) and C6 (Pct 48%). Matteo Ciccarelli scored 5 goals (from 6 shots), Carlos Flores 9 of 19 or Massimiliano Nastasi 3 of 6 from within these areas.
The quota of Matteo in this Subbuteo shot analysis is impressive, though: Whenever he reached the best shooting sectors you can be sure it is going to be a goal for him. Besides other factors, that seemed to be a key to his success story.
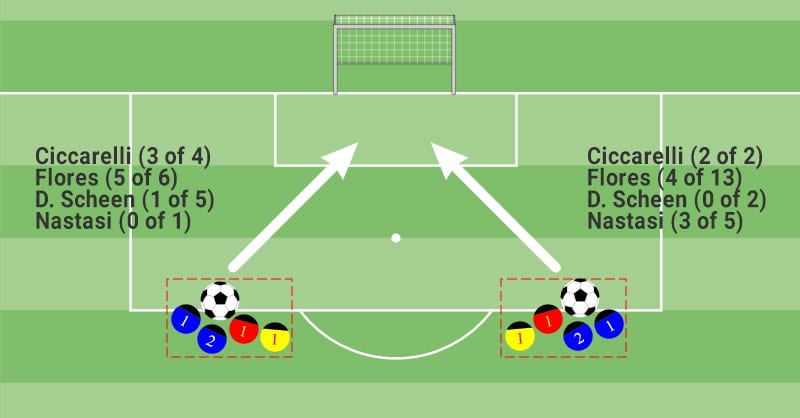
List of players who shot most often from the green sectors (> 45% Goal success percentage).
3 of 4 means the player shot four times and made three goals from there.
Summary #tl;dr
Subbuteo meets Big Data: I investigated more than 500 shots from the world’s best Subbuteo Table Football players. Using descriptive statistical methods, my analysis wanted to find out which spots on the pitch are the most promising for shooting goals.
No surprise that the Subbuteo shot analysis showed an accumulation of shots from the left and right wing. Facing strong defensive lines, top players shift their attacking figures to the far right or left before entering the shooting area.
In a heatmap, I divided the shooting area into equally sized sectors and calculated shooting percentages for each one. I identified two sectors close to the penalty box from which almost every second shot led to a goal.
Individual players’ stats showed that some competitors reach these sectors more often than others. Best shooter from there: the new World Champion from Italy.
Coincidence?
Disclaimer: Remember that this hasn’t been a representative study. I recorded all the data carefully but measurement errors might be possible nevertheless.
Bambersky – D. Scheen 1:2 (Final GP Issy 2017)
Colangelo – Leitner 1:2 (Final World Cup 2016)
Noguera – Leitner 4:3 (Semi-finals World Cup 2016)
Huynh – Bertelli 1:2 (Round of 16 World Cup 2016)
Flores – Nastasi 7:2 (Final World Cup 2015)
Zambello – D’Heur 2:1 (Round of 32 Major Frameries 2016)
Diradourian – Despretz 2:3 (Final IO Puylaurens 2015)
Nastasi – Borg 2:3 (Last 32 Major Frameries 2015)
Flores – Nastasi 8:3 (Quarter-finals Major Frameries 2016)
D’Heur – Targui 2:1 (Final GP Issy 2015)
Kegenbein – Guimares 3:1 (Round of 16 Major Frameries 2014)
Targui – Noguera 2:3 (Round of 16 GP Issy 2014)
Flores – Plytas 10:0 (Group stage World Cup 2018)
Kegenbein – Leitner 2:1 (Final GP Austria 2014)
Cicarelli – Bari 3:2 (Semi-finals Coppa Italia 2016)
Filippella – Cranston 3:1 (Final IO Los Angeles 2018)
D. Scheen – P. Scheen 2:3 (Quarter-finals World Cup 2018)
Bertelli – Ciccarelli 2:4 (Semi-finals World Cup 2018)
Montano – Naszalyi 1:4 (Group stage World Cup 2018)
Leroy – Colangelo 2:1 (Round of 16 Major Frameries 2015)
Montano – Giaux 1:1 (Group stage World Cup 2018)
Ciccarelli – Leroy 5:0 (Final World Cup 2018)
Filippella – Huynh 2:2 ET (Round of 32 World Cup 2018)
Ciccarelli – Buono 5:3 (Semi-finals GP Firenze 2016)
S. Scheen – Noguera 1:4 (Quarter-finals World Cup 2016)
P. Scheen – Flores 2:3 (Final IO Puylaurens 2012)
D. Scheen – Bambersky 2:2 (Group Stage World Cup 2013)
YOUR WEBSITE IS AMAZING. THE CONTENT IS SO COMPLETE. YOU HAVE EXTENDED TOPICS BEYOND RANGES SEEN BEFORE. I LOVE IT. KEEP DOING WHAT YOU DO. YOU HAVE A GREAT INSIGHT INTO DIVIDING UP INTERESTING CONTENT IN AN INFORMATIVE AND SUPERBLY ILLUSTRATED WAY.